Engagement Rate: How to Calculate It and Why It Sets the Price
A clear guide to engagement rate: the main formulas, which interactions to count, how to compare accounts fairly, and why buyers pay more for an audience that responds.

Follower counts get the attention, but engagement is what buyers and brands really pay for. An account where people like, comment, save and share is an account with an audience that listens. Engagement rate turns that into a number you can compare, as long as you calculate it the same way each time. This guide explains how to calculate engagement rate, which version to use, how to read it honestly and why it plays such a large part in the price of a social media account.
If you’re preparing an account for sale, read this alongside our guide to selling a social media account. Buyers can pair it with our guide to spotting fake followers.
Key takeaways
- Engagement rate is interactions divided by a base, such as followers, reach or views, times 100.
- Always state which base you used; rates on different bases can’t be compared.
- Calculate over many recent posts, not one viral hit.
- Saves, shares and real comments say more than likes alone.
- Buyers pay more for steady, verified engagement from the right audience.
What is engagement rate?
Engagement rate measures how much an audience interacts with content compared with how many people could have. Interactions usually include likes, comments, saves and shares, and on some platforms replies, reposts or link taps. The result is a percentage, so a small account and a large one can be compared on the same scale.
Platforms report the raw numbers in their own analytics. Instagram Insights, for example, shows accounts reached, accounts engaged and interactions such as likes, comments, saves, shares and replies. YouTube Analytics has an Engagement tab with figures such as watch time and average view duration. The rate is a calculation you make from numbers like these, which is why the method matters so much.
How to calculate engagement rate
There are three common formulas. Each divides interactions by a different base:
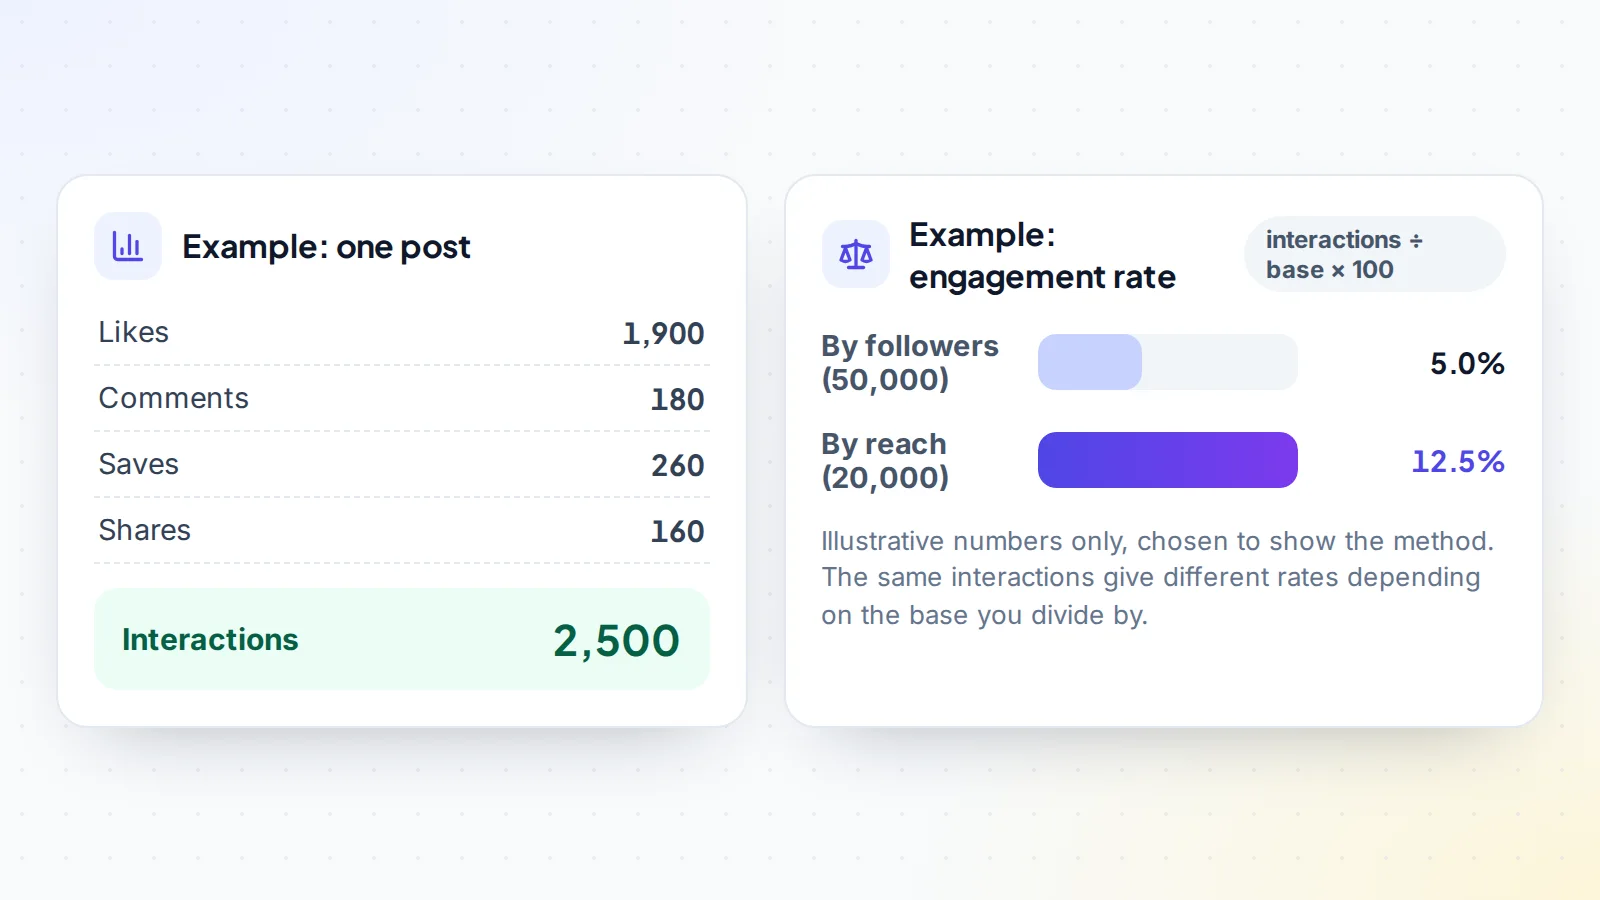
- By followers: interactions on a post ÷ follower count × 100. Simple, and easy to compare across public accounts, because follower counts are visible.
- By reach: interactions ÷ accounts reached × 100. Measures how people who actually saw the post responded. It needs access to the account’s analytics.
- By views: interactions ÷ views × 100. Common for video platforms, where views are the main measure of attention.
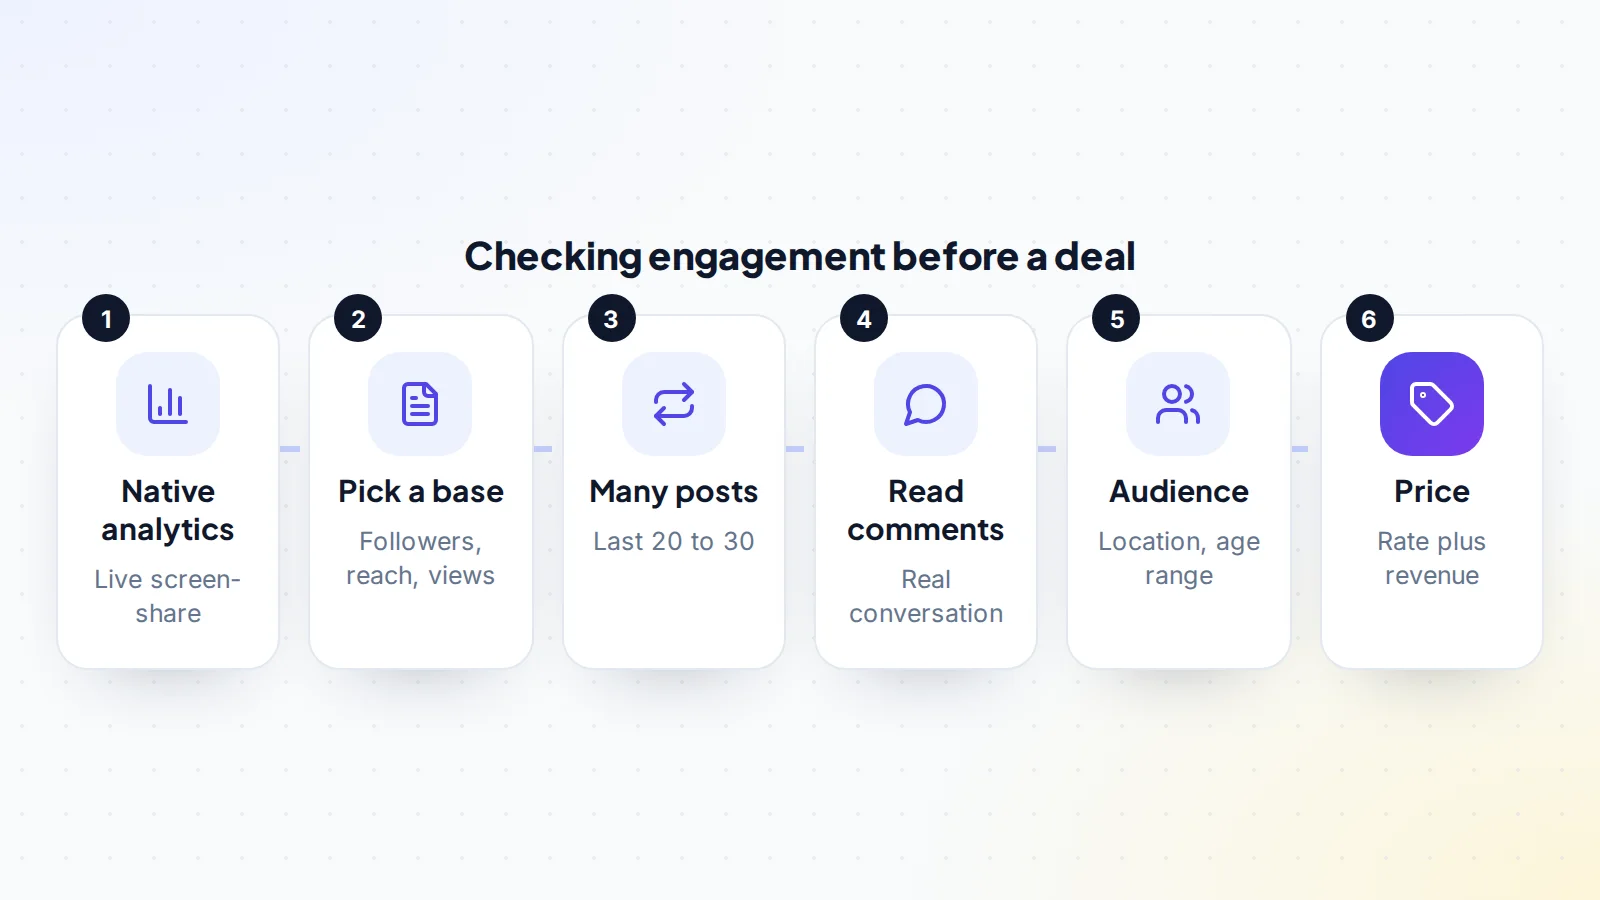
For an account, calculate the rate for each of the last 20 to 30 posts and take the average, or add up all interactions and divide by the total base. Either is fine, as long as you use the same method when comparing.
Which formula should you use?
The follower-based rate is the easiest way to compare public accounts, and it reflects how much of the whole audience is still active. The reach-based rate is usually higher, because reach is smaller than the follower count, and it tells you how compelling the content is to those who see it. A view-based rate suits short video, where many viewers may not follow the account.
In a sale, the most useful approach is to look at more than one. A buyer might note the follower-based rate for comparison with similar listings, then check the reach-based rate in the account’s own analytics to confirm the audience is genuinely active. Whatever you use, write the formula next to the number in your listing or notes.
Which interactions to count
Not all interactions mean the same thing. A like takes a second. A thoughtful comment, a save to come back to later or a share to a friend shows stronger interest. Some people weight these differently in their own analysis, but there’s no standard set of weights, so keep it simple: count the core interactions consistently and look at the mix separately.
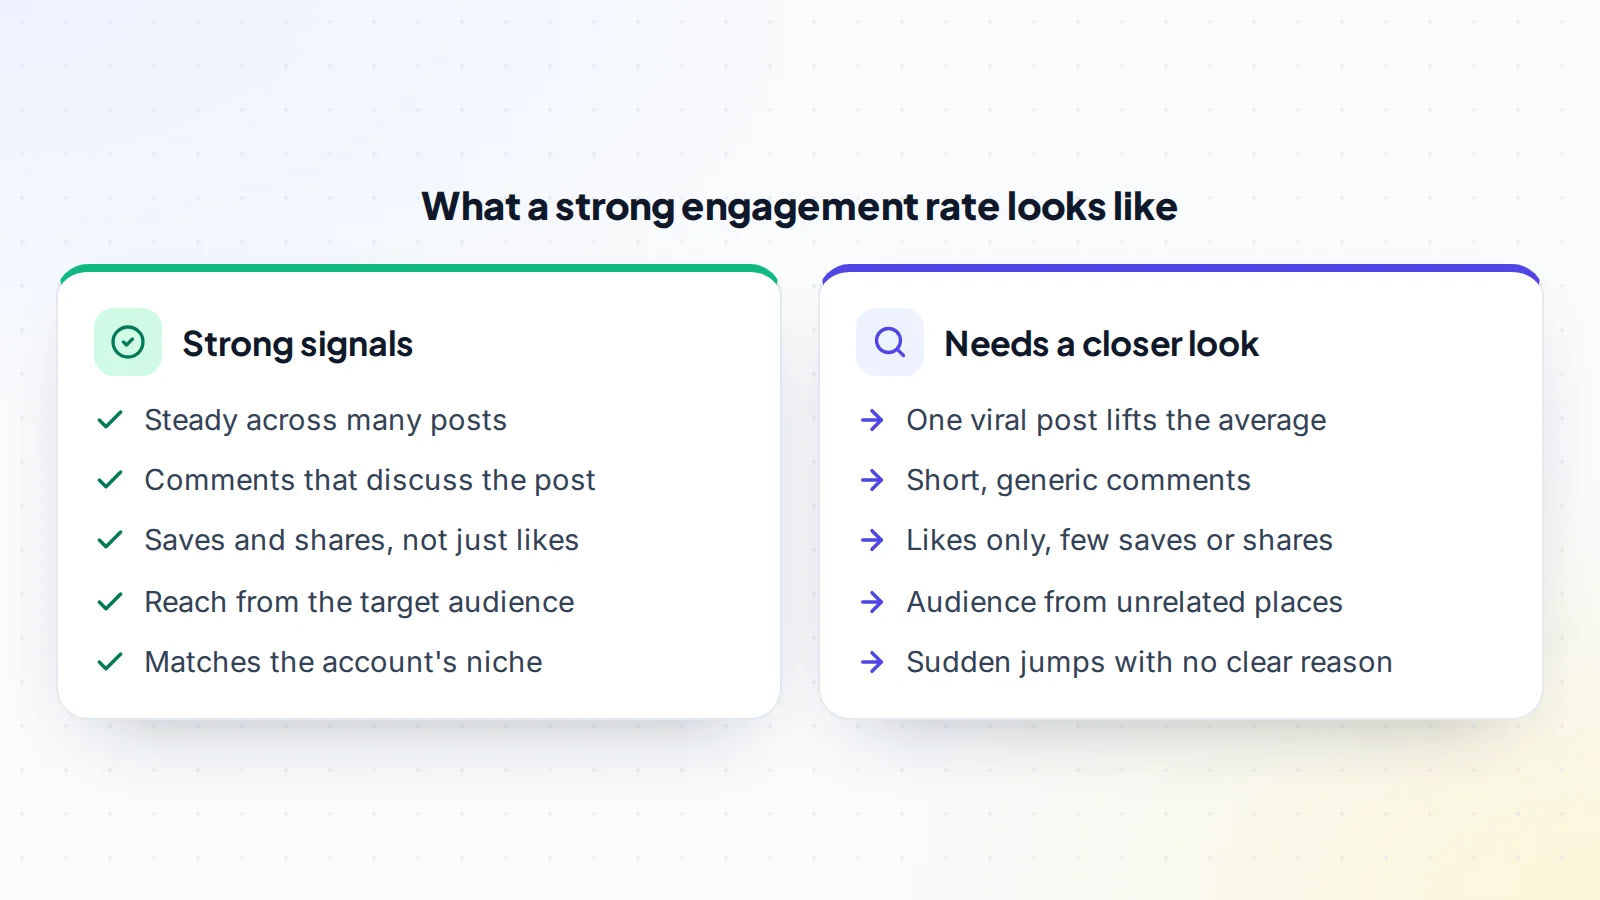
A healthy mix often includes a good share of saves and shares alongside likes, and comments that refer to the post itself. If an account’s interactions are almost all likes, with few saves, shares or real comments, it’s worth looking more closely at where they come from.
What counts as a good engagement rate?
Many websites publish benchmark figures, but they use different formulas, samples and time periods, and platforms change how content is shown. There’s no single official benchmark from the platforms themselves. A better approach is to compare like with like: accounts on the same platform, in the same niche, at a similar size, measured with the same formula.
Size matters too. Smaller accounts often show higher rates than very large ones, because a close-knit community responds more per person. So a lower rate on a much larger account isn’t necessarily weaker; what matters is how it compares with similar accounts and whether it’s steady or rising over time. Our guide to growth trends and valuation explains why direction matters as much as level.
Reading the number honestly
A single number can mislead. Before relying on any rate, check a few things:
- Consistency: is the rate steady across posts, or lifted by one or two viral ones? Look at the median as well as the average.
- Time period: use recent posts. An account that was very active two years ago may be quieter now.
- Content types: reels, carousels, stories and long videos often perform differently. Compare like with like.
- Comment quality: read the comments. Real ones discuss the post, ask questions or tag friends.
- Audience: check where engaged accounts are located and their age ranges, and whether that fits the niche and the buyer’s plans.
Sudden jumps with no clear reason, or a mismatch between engagement and the audience the account says it serves, deserve questions rather than assumptions.
Why engagement rate sets the price
When people buy a social media account, they’re buying access to attention. Engagement shows how much attention the account really commands. It affects price in several ways:
- Brand deals: brands look at engagement when deciding what to pay for sponsored posts, so it affects future income.
- Product sales: an engaged audience is more likely to click, sign up and buy.
- Reach: content that people interact with is often shown to more people, helping growth.
- Risk: steady, genuine engagement suggests the audience will still be there after the sale.
Two accounts with the same follower count can therefore sell for very different prices. The one with a steady, verified rate and a matching audience usually wins.
Engagement on different platforms
Each platform shows engagement in its own way. On Instagram, Insights reports accounts reached, accounts engaged and interactions for posts, stories and reels. On TikTok, views, likes, comments and shares are central, and many videos reach people who don’t follow the account, so view-based rates are common. On YouTube, engagement is about watch time, average view duration and how viewers respond, as well as likes and comments. Telegram channels and communities are often judged by views per post and active discussion.
When comparing accounts across platforms, don’t compare their rates directly. Compare each account with similar accounts on its own platform. Our guides to buying a TikTok account and selling a TikTok account cover what matters there.
Verifying engagement before a deal
Public numbers are a starting point, but the account’s own analytics are where you confirm them. Ask the seller to open the platform’s native analytics on a live screen-share and show reach, interactions and audience details for recent posts. Compare these with what you can see publicly. On digiflippers.com, some platforms can be connected for read-only checks; see how verification works.
Keep a note of what you saw and when, and write the key figures into the deal terms. Our guide to buyer protection for digital assets explains how to keep the payment protected while you check.
How sellers can show engagement at its best
If you’re selling, the best way to present engagement is openly and with context. Prepare:
- Rates by followers and by reach for the last 20 to 30 posts, with the formulas stated.
- A note of your best and weakest posts, and why they performed as they did.
- Audience location and age ranges from your analytics.
- Examples of real conversations in comments or messages.
- Any brand deals and the results they achieved.
Then keep posting consistently while the account is for sale. Engagement that holds steady during the sale is reassuring to buyers. When you’re ready, list your account on digiflippers.com with 0% success fee up to $10,000, then 5% (max $5,000).
Tracking engagement over time
A one-off calculation is useful, but a monthly record is far more convincing. Sellers who note reach, interactions and the resulting rate each month build a history buyers can check against the analytics, month by month. It also shows how the account responds to changes, such as a new posting schedule, a shift to short video or a series that took off. Buyers can do the same during due diligence: ask for the monthly figures for the past year and look for a steady or rising line rather than a single strong month.
Keep the method fixed across the record. If you switch from follower-based to reach-based figures halfway through, start a new column rather than mixing them, so the trend stays honest and easy to read.
A worked example
The details below are made up to show the method.
Leah is comparing two fitness accounts for sale, each with about 50,000 followers. Account A shows a follower-based rate of 5.0%, and on a screen-share its Insights show recent posts reaching about 20,000 accounts each, with around 2,500 interactions: a reach-based rate of 12.5%. Comments discuss training plans, and saves are a large share of interactions. The rate is steady over the last 30 posts.
Account B shows a higher follower-based average, but one recent post went viral and lifts the whole figure. Without that post, the rate is well below Account A’s, and most of its interactions are likes with few comments. Leah checks the audience: Account A’s engaged accounts are mostly in the countries the fitness brand Leah works with sells to. Account B’s are spread more widely.
Leah decides Account A is worth a higher price, despite a similar follower count, because its engagement is steady, genuine and from the right audience. Leah then looks at revenue and growth to settle on an offer, and browses other social media accounts for sale to compare.
Common mistakes
- Comparing rates calculated with different formulas.
- Using one viral post as if it were typical.
- Comparing a small account’s rate directly with a very large account’s.
- Counting likes only and ignoring saves, shares and comment quality.
- Relying on screenshots instead of live native analytics.
- Treating engagement as the whole price, without revenue and growth.
Engagement rate: the checklist
- Formula chosen and stated: by followers, reach or views.
- Rate calculated over the last 20 to 30 posts.
- Median checked as well as average.
- Mix of likes, comments, saves and shares reviewed.
- Comments read for real conversation.
- Audience location and age ranges checked against the niche.
- Figures confirmed live in native analytics.
- Compared only with similar accounts on the same platform.
- Engagement weighed together with revenue and growth.
Ready to find your next asset?
Browse listings with verified numbers, ask sellers your questions before you offer, and agree every step in a free Deal Room.
Frequently asked questions
What is the engagement rate formula?
Interactions divided by a base, times 100. The base is usually followers, accounts reached or views. Always say which one you used.
Is a reach-based rate better than a follower-based one?
They answer different questions. Follower-based rates are easy to compare publicly; reach-based rates show how people who saw the content responded. Looking at both gives a fuller picture.
What is a good engagement rate?
There’s no single official benchmark. Compare with similar accounts on the same platform, in the same niche and at a similar size, using the same formula.
Why do smaller accounts often have higher rates?
Smaller communities are often closer-knit, so more of the audience responds to each post. That’s why size should be considered when comparing.
Which interactions should I count?
Usually likes, comments, saves and shares, plus platform-specific ones such as replies. Count them consistently, and look at the mix separately.
How do buyers check engagement?
They view native analytics live on a screen-share, compare them with public numbers, read comments and check the audience details.
Does engagement decide the price on its own?
No. It’s a major factor, but buyers also look at revenue, growth, audience and how smoothly the account will transfer.