Why Buyers Use Trailing Twelve-Month Profit
Why buyers value online businesses on the last 12 months of profit, how to calculate it month by month, and when a different period tells the truth better.

When buyers price an online business, the first number they look for is profit over the last 12 months. It’s called trailing twelve months profit, or TTM profit, and it’s the most common base for valuing websites, SaaS products, content businesses and digital product stores. Understanding how it’s calculated, and when it can mislead, helps buyers avoid overpaying and helps sellers present their numbers convincingly.
This guide explains what TTM means, how to calculate it month by month, why buyers prefer it to other periods, how seasonality, growth and add-backs affect it, and how to use it in a valuation. It builds on our full guide to online business valuation.
Key takeaways
- TTM profit is net profit over the most recent 12 complete months, whatever the calendar or tax year.
- Buyers like it because it covers a full year of seasons while staying recent.
- It’s usually shown month by month, then totalled or averaged.
- Compare the TTM average with the last 3 to 6 months to see the trend.
- Adjustments (add-backs) should be applied within the same 12 months and documented.
What trailing twelve months profit means
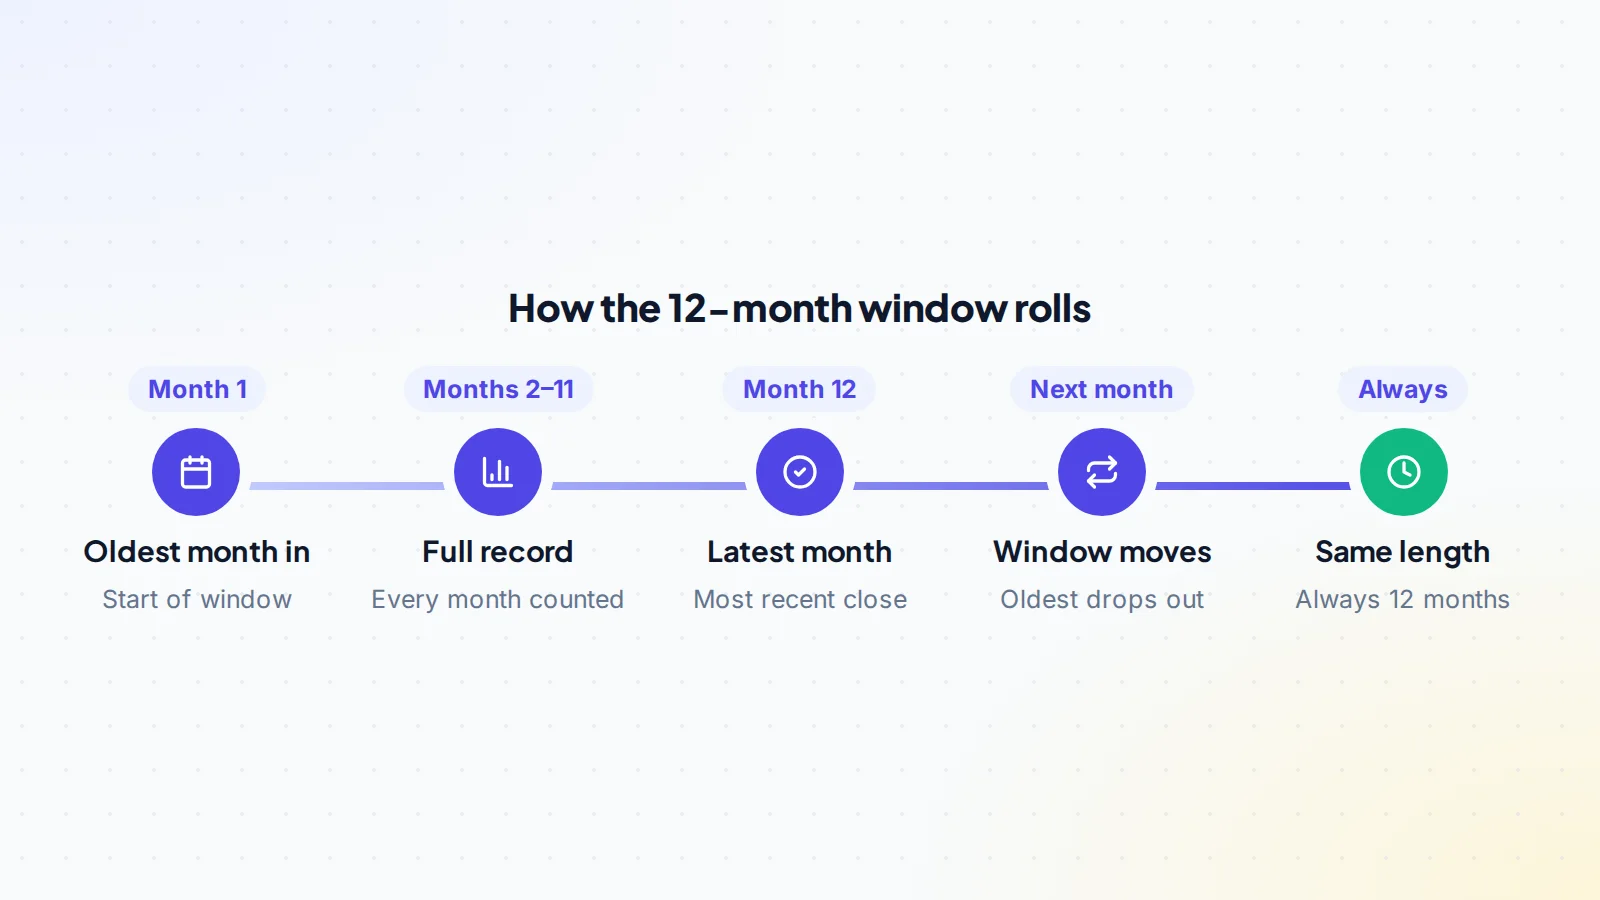
“Trailing” means looking back from now. Trailing twelve months profit is the business’s net profit over the last 12 complete months, ending with the most recently closed month. If it’s now mid-October, TTM usually runs from October of last year to September of this year.
It isn’t the same as the last financial or tax year, which may have ended many months ago. TTM is always as recent as possible while still covering a full year.
TTM, LTM, YTD and run rate
You’ll see several similar terms in listings and valuations:
- TTM (trailing twelve months) and LTM (last twelve months) mean the same thing: the most recent 12 complete months.
- YTD (year to date) covers the start of the current calendar or financial year up to now, so its length changes during the year. It’s not directly comparable with a 12-month figure.
- Run rate takes a recent period, often one month or three, and multiplies it up to a year. It’s useful for fast-growing businesses, but it assumes the recent period will repeat, which can be misleading for seasonal ones.
- Calendar or fiscal year figures come from annual accounts or tax returns. They’re reliable and audited in some cases, but may be out of date.
When comparing businesses, make sure you’re comparing the same kind of figure.
Building the monthly table
A good TTM table has one row per month and columns for:
- Month.
- Revenue by source (for example ads, affiliate, product sales, subscriptions).
- Refunds and chargebacks.
- Costs by category (hosting, software, contractors, advertising, fees).
- Net profit.
- Notes explaining anything unusual.
Add a total row and an average row at the bottom, and a separate adjustment schedule underneath. Buyers can then check each figure against its source and see at a glance how the year went.
When there’s less, or more, than 12 months
Young businesses may not have 12 months of history. In that case, value on the months available, but expect buyers to use a lower multiple, because there’s no full year of seasons to check. At the other end, buyers often ask for 24 or 36 months of history for established businesses. Trailing twelve months profit remains the base for the price, while the longer history shows whether this year is typical, better or worse than previous ones.
Why buyers use it
- It covers every season. Many online businesses earn more in some months than others; a full year captures the highs and lows.
- It’s recent. A calendar year that ended ten months ago can hide a recent change. TTM includes the latest months.
- It smooths out one-off spikes. A viral month or a big one-off sale counts as one month out of twelve, not the whole picture.
- It’s comparable. Valuation multiples are usually quoted against a 12-month or average-monthly figure, so TTM fits directly.
The U.S. Small Business Administration’s guidance on buying a business lists several valuation approaches, many of which start from the business’s earnings. TTM is the standard way to choose which earnings to use.
How to calculate it
- Pick the 12 months: the last 12 complete months, ending with the most recent month that’s fully closed.
- List revenue by month from every source, after refunds and chargebacks.
- List costs by month: hosting, software, contractors, advertising, payment fees, platform fees and everything else the business needs.
- Calculate net profit for each month: revenue minus costs.
- Total the 12 months for TTM net profit, and divide by 12 for the monthly average.
- Apply justified adjustments within the same period, each with evidence. See add-backs.
Show the monthly table, not just the total. Buyers want to see each month, because the shape of the year tells them as much as the total does.
A worked example
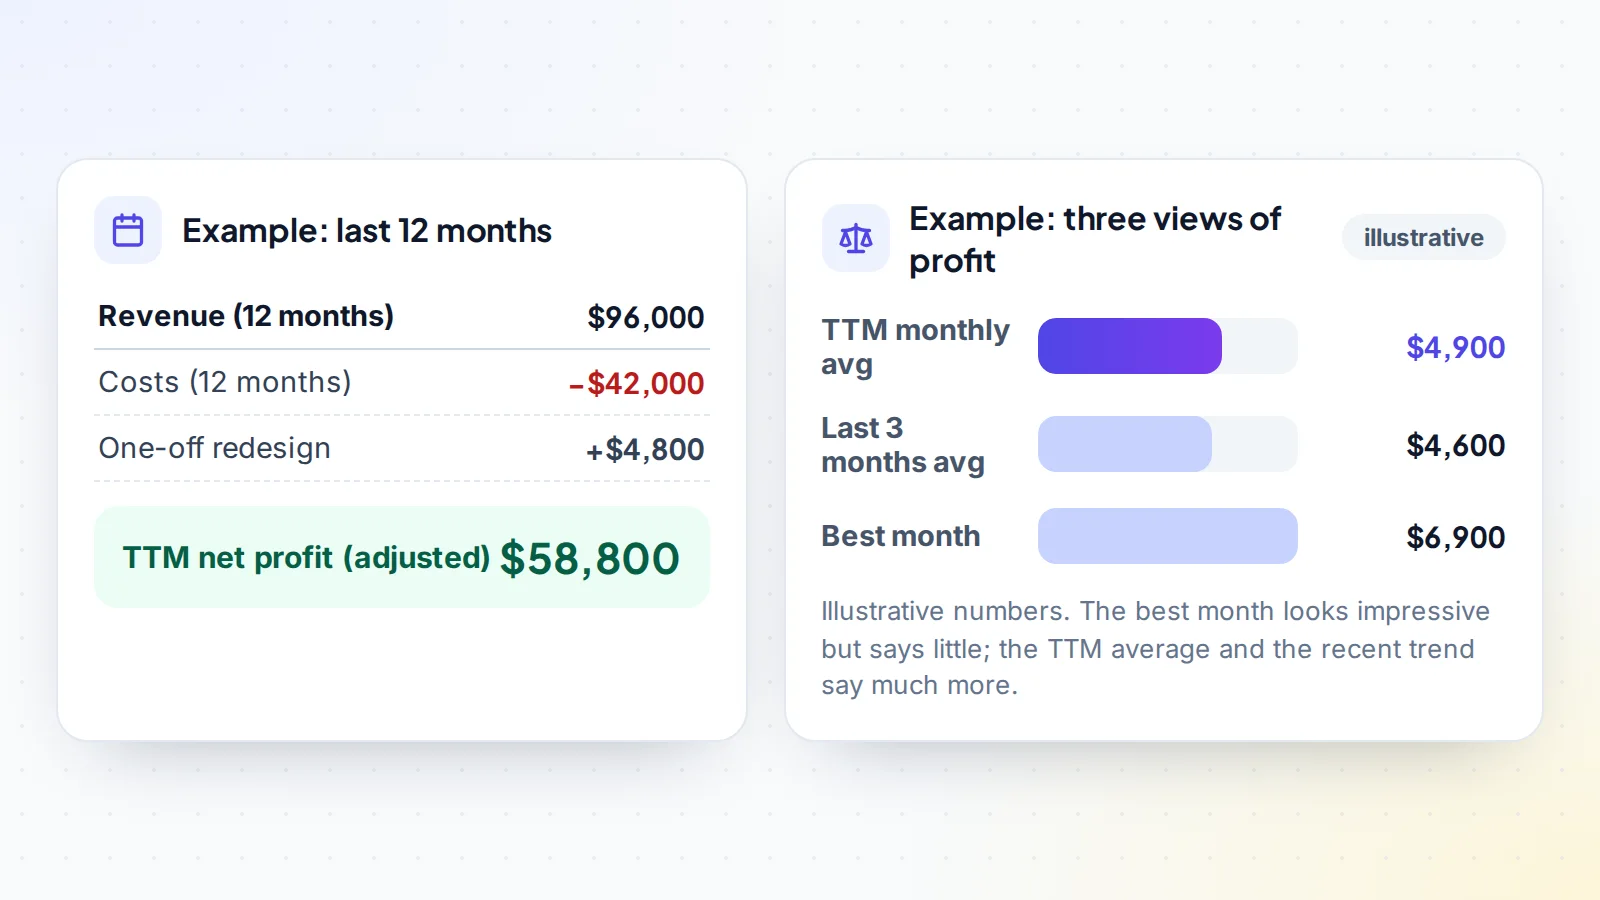
The numbers below are made up to show the method, not market data.
A content site’s last 12 months show revenue of $96,000 and costs of $42,000. One of those costs was a $4,800 site redesign that won’t recur, which the seller documents with invoices. Adjusted TTM net profit is $58,800, or an average of $4,900 a month.
Looking at the monthly table, the best month earned $6,900, during a seasonal peak. The last three months averaged $4,600, a little below the TTM average. That tells the buyer something useful: the business is steady but slightly softer recently. They value it on the TTM average and ask the seller about the recent dip before agreeing the multiple.
Compare TTM with recent months
TTM shows the year; recent months show the direction. Compare the TTM monthly average with the average of the last 3 or 6 months:
- Recent average above TTM: the business is growing. Sellers may argue for valuing it on recent months; buyers will want evidence the growth is lasting.
- Recent average close to TTM: the business is steady.
- Recent average below TTM: the business may be declining. Buyers will often value on the lower recent figure, or ask why.
Seasonality
Many businesses have strong and weak seasons: gift guides peak before holidays, tax tools before deadlines, planners at the start of the year. TTM handles this well because it always includes every season once. Problems arise when someone uses a shorter period: three peak months make a business look much bigger than it is, three quiet months much smaller. That’s why 12 months is the usual minimum for seasonal businesses.
Fast-growing and declining businesses
TTM can understate a fast-growing business, because early months were smaller than today’s. Buyers and sellers sometimes use a weighted view, giving recent months more weight, or value on recent monthly profit with a lower multiple to reflect the extra uncertainty. For subscription businesses, recurring revenue run rates are also used; see MRR vs ARR.
For a declining business, TTM can overstate profit, because early months were better than today’s. Here, buyers usually rely on recent months and ask what’s driving the decline. Whatever approach is used, it should be explained and agreed, not assumed.
Revenue or profit?
TTM can be applied to revenue or to profit, and the two are very different. Most small online businesses are valued on profit, because profit is what the owner keeps. Revenue-based valuations are mainly used for some growing software businesses. Always check which figure a listing quotes; our guide to revenue vs profit valuation explains the difference.
How buyers check TTM figures
- Monthly table of revenue and costs for all 12 months.
- Source records: payment processor, ad network and affiliate dashboards, shown live or through read-only access.
- Bank records showing payouts that match the revenue.
- Cost evidence: invoices and statements for the main costs.
- Adjustment schedule with evidence for each item.
Our guide to financial due diligence covers each check. And because concentration affects how reliable the TTM figure is, read about traffic concentration risk too.
From TTM to a price
Once TTM profit is agreed, the price is usually the monthly average times a monthly multiple, or the annual total times an annual multiple. The multiple reflects stability, growth, diversification and how much work the business needs. Read about the online business valuation multiple, or try the free valuation tool for a quick range.
TTM across different businesses
- Content and affiliate sites: TTM captures seasonal shopping and search patterns. Check traffic for the same 12 months.
- E-commerce stores: TTM includes peak seasons; check stock and advertising costs for the same period. See buying an e-commerce store.
- SaaS: TTM profit is used alongside recurring revenue and churn; check development costs carefully. See SaaS technical due diligence.
- Digital products and courses: separate launch months from steady months within the TTM table.
For sellers: presenting TTM well
- Prepare a clean monthly table for the last 12 complete months.
- Show revenue after refunds and every cost, including your own work if a buyer would pay for it.
- Document any adjustments with evidence.
- Explain unusual months: peaks, dips and one-offs.
- Connect your data sources so buyers can verify the figures.
For buyers: using TTM in negotiation
TTM gives buyers a shared, checkable starting point. A few habits make it work for you:
- Rebuild the table yourself from the source data, rather than relying on the seller’s summary.
- Agree the figure before the multiple. Settling on adjusted TTM profit first stops the conversation from mixing two arguments at once.
- Explain your view of the trend with the recent-months comparison, and show why it affects your offer.
- Watch the cut-off: if negotiations take weeks, a new month may close. Update the table so both sides are looking at the same 12 months.
- Remember costs you’ll add: if you’ll pay for work the seller did themselves, your own expected profit will be lower than the seller’s TTM figure.
Keeping TTM up to date during a sale
Sales can take a month or more. Each time a month closes, the TTM window moves: one old month drops out and a new one comes in. Sellers should update the table promptly and explain the new month, especially if it’s notably better or worse. Buyers should ask for the update before signing, so the price reflects the latest complete year.
Common mistakes
- Using the last tax year when it ended many months ago.
- Including a partial current month.
- Showing totals only, without the monthly table.
- Annualising a few strong months instead of using 12 real ones.
- Applying adjustments from outside the period.
Tools that help
A simple spreadsheet is enough for most small businesses. Export monthly reports from the payment processor, ad networks, affiliate programmes and store platform, and paste them into one sheet with a row per month. Accounting software can produce a profit and loss report for any 12-month range, which saves time and reduces errors. Whatever tool you use, keep the original exports, so every number can be traced back to its source.
Trailing twelve months profit: the checklist
- Last 12 complete months identified.
- Revenue by month, after refunds.
- All costs by month.
- Net profit by month, total and average.
- Adjustments documented within the same period.
- TTM average compared with the last 3–6 months.
- Figures verified against source records and payouts.
Ready to find your next asset?
Browse listings with verified numbers, ask sellers your questions before you offer, and agree every step in a free Deal Room.
Frequently asked questions
What does TTM stand for?
Trailing twelve months: the most recent 12 complete months, counted back from the latest closed month.
Is TTM the same as annual profit?
Not necessarily. Annual profit usually means a financial or tax year, which may have ended months ago. TTM is always the latest 12 months.
Why not just use the last few months?
Short periods can be distorted by seasons or one-off events. TTM covers a full year while staying recent. Recent months are best used alongside it to show the trend.
Should a partial month be included?
No. Use complete months only, so each month is comparable.
How are add-backs handled in TTM?
Each adjustment should relate to the same 12 months and be backed by evidence. Show them separately from the raw profit.
Can trailing twelve months profit be negative?
Yes, if costs exceeded revenue over the year. Such businesses are usually valued on assets, audience or potential rather than a profit multiple.
How many months of history should a seller provide?
At least the 12 months used for TTM, and ideally 24 or more, so buyers can see whether this year is typical.