Churn Rate Explained: How It Changes a SaaS Valuation
How to calculate customer churn, revenue churn and net revenue retention, what the numbers mean over a year, and why churn moves a SaaS price so much.

In a subscription business, every month starts with a leak. Some customers cancel, some downgrade, and the business has to replace them before it can grow. The SaaS churn rate measures that leak, and for anyone buying or selling software, it’s one of the numbers that matters most, because it decides how long today’s revenue will last.
This guide explains the different kinds of churn, how to calculate each one, what the numbers mean over a year, how churn interacts with growth, and why it moves a SaaS valuation so strongly. It also covers how buyers check churn and how sellers can improve it before a sale.
For the bigger picture, see our guides to SaaS metrics and MRR vs ARR.
Key takeaways
- Customer churn counts lost customers; revenue churn counts lost recurring revenue. They can tell different stories.
- Net revenue retention adds upgrades back in: above 100% means existing customers are growing revenue overall.
- Monthly churn compounds. At 5% a month, only about 54% of customers remain after a year without new sign-ups.
- Low, stable churn supports a higher valuation multiple; high or rising churn pulls it down.
- Buyers recalculate churn from the payment system themselves, by cohort, rather than relying on a single figure.
What churn means
Churn is the share of customers, or revenue, a subscription business loses over a period. It includes cancellations, non-renewals and, for revenue churn, downgrades to cheaper plans. Some churn is unavoidable: customers’ needs change, businesses close, budgets shrink. What matters is how much, how steady, and why.
Churn is usually measured monthly for products billed monthly, and annually for products billed yearly. Always check which period a figure refers to before comparing it.
Customer churn
Customer churn counts people or accounts. Stripe describes the standard formula as the number of customers lost during a period divided by the number of customers at the start of the period, multiplied by 100.
Customer churn = customers lost ÷ customers at the start × 100
If a product starts the month with 400 customers and 12 cancel, monthly customer churn is 3%. New customers who sign up during the month aren’t part of this calculation; they’re tracked separately as growth.
Customer churn is easy to understand, but it treats every customer equally. Losing ten customers on the cheapest plan counts the same as losing ten on the most expensive one.
Revenue churn
Revenue churn measures the recurring revenue lost from existing customers, through cancellations and downgrades. Stripe explains gross revenue churn as the revenue lost from cancellations and downgrades over a period, divided by the recurring revenue at the start of the period.
Gross revenue churn = (churned MRR + contraction MRR) ÷ starting MRR × 100
Revenue churn is often more useful for valuation than customer churn, because it measures what actually affects income. A product can have high customer churn among small accounts but low revenue churn if its larger customers stay.
Net revenue retention
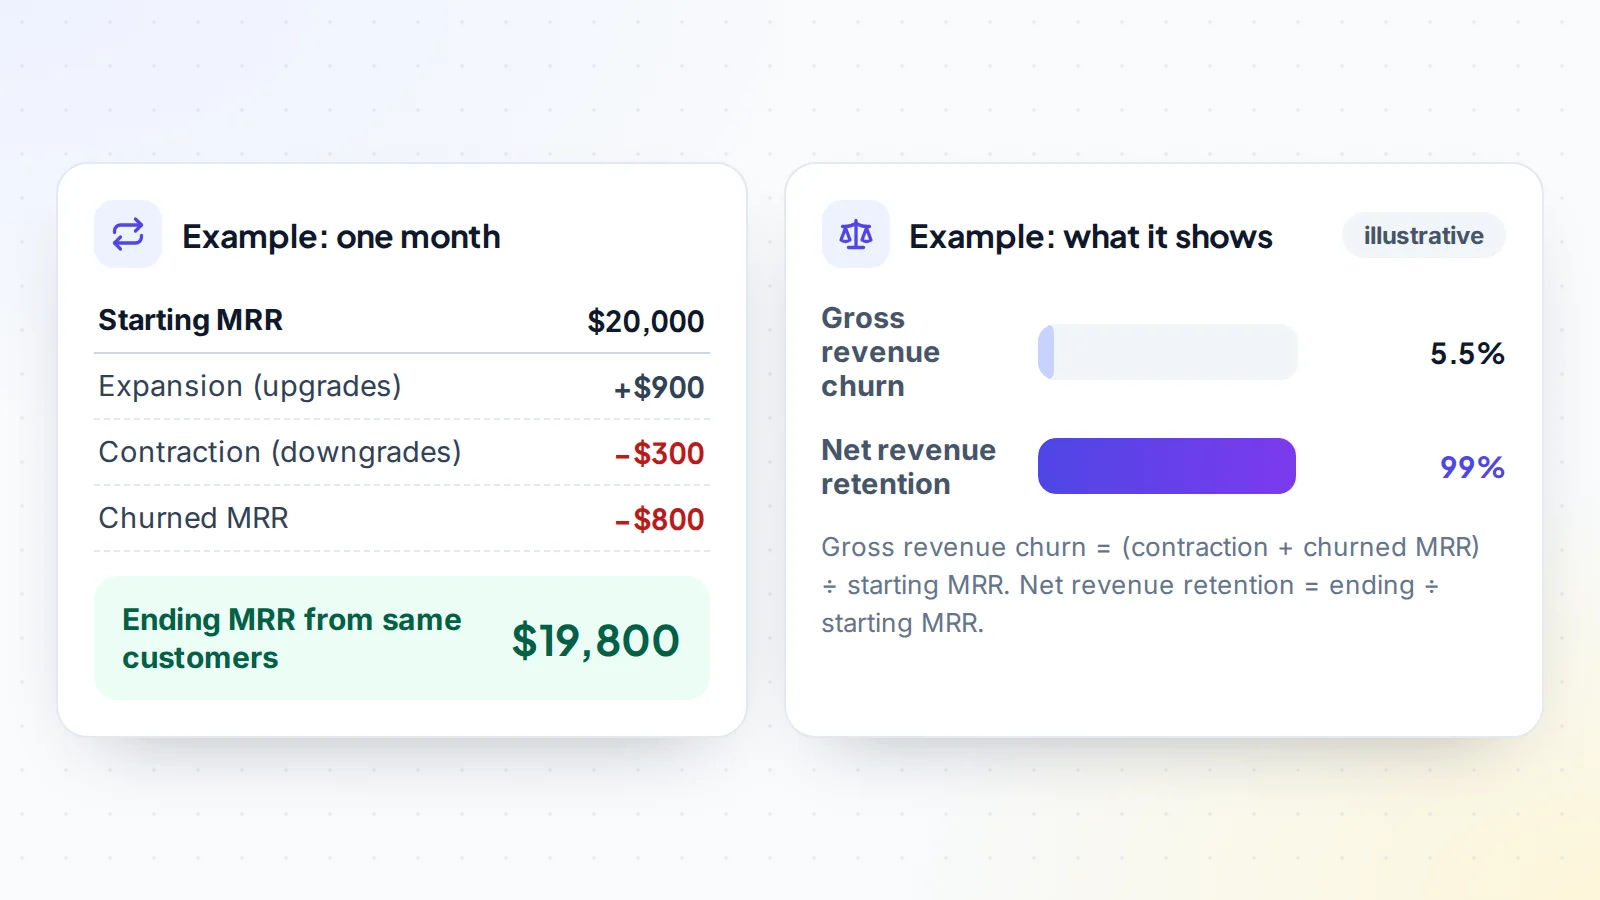
Net revenue retention (also called net dollar retention) adds the other side of the story: upgrades. Stripe defines it as starting recurring revenue, plus expansion, minus contraction and churn, divided by starting recurring revenue.
Net revenue retention = (starting MRR + expansion − contraction − churned MRR) ÷ starting MRR × 100
Above 100% means revenue from existing customers is growing on its own, even before any new customers sign up. Below 100% means the existing base is shrinking. For buyers, this is one of the clearest signs of whether customers find more value in the product over time.
Why monthly churn matters so much
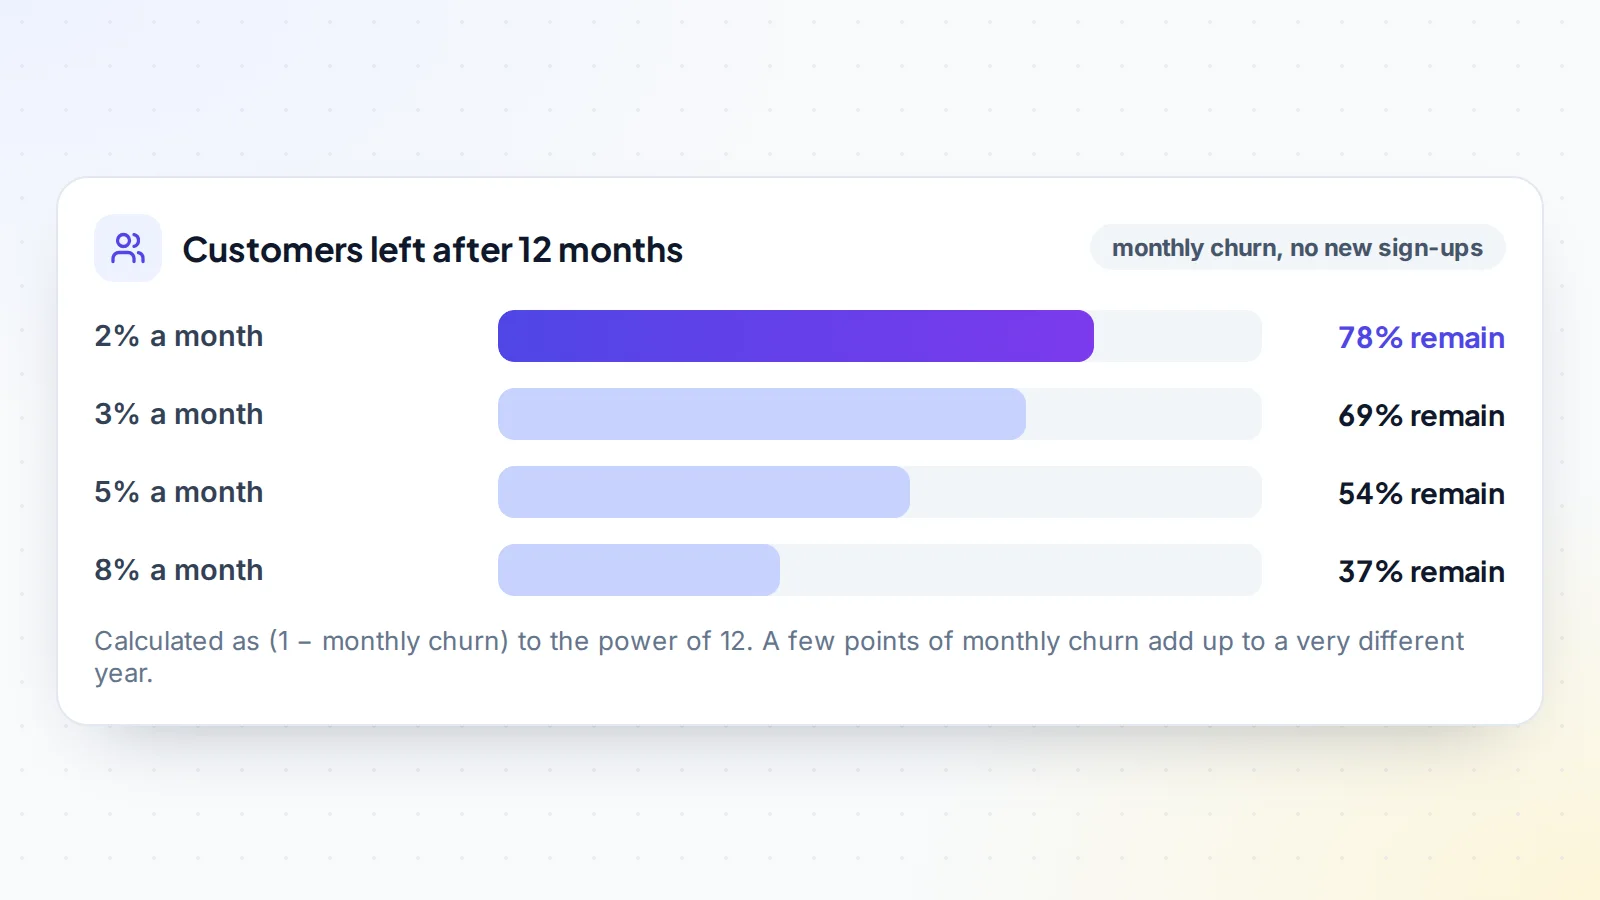
Churn compounds. A monthly rate that sounds small adds up over a year. With no new sign-ups, the share of customers still subscribed after 12 months is (1 − monthly churn) to the power of 12:
- At 2% a month, about 78% remain.
- At 3% a month, about 69% remain.
- At 5% a month, about 54% remain.
- At 8% a month, about 37% remain.
A business at 8% monthly churn has to replace almost two-thirds of its customers every year just to stand still. One at 2% can grow with far less effort. That difference is why buyers look at the SaaS churn rate before almost anything else.
Churn and growth together
Churn never tells the whole story on its own. A product adding customers quickly can grow despite high churn, and a product with very low churn can stagnate if it stops attracting new customers. Buyers look at both:
- New MRR: revenue from new customers each month.
- Expansion MRR: upgrades and add-ons from existing customers.
- Churned and contraction MRR: what’s lost.
- Net new MRR: the result of all three.
The healthiest pattern is steady new revenue, meaningful expansion and low, stable churn. The weakest is growth that depends on constant spending on ads to replace customers who leave.
How churn changes a valuation
SaaS businesses are valued on the expectation that recurring revenue will continue. Churn is the direct measure of how much of it won’t. Lower churn means:
- Revenue lasts longer, so each customer is worth more over their lifetime.
- Growth is cheaper, because less effort goes into replacing lost customers.
- The buyer’s forecast is more reliable.
All three support a higher valuation multiple. Rising churn, churn concentrated in recent months, or churn that the seller can’t explain does the opposite. Read about the online business valuation multiple for how buyers turn these factors into a price, and our guide to buying a SaaS business for the wider checklist.
A worked example
The numbers below are made up to show the method, not market data.
A buyer is looking at a scheduling tool with $20,000 of monthly recurring revenue and 500 customers. The seller’s listing says churn is “about 2%”. The buyer asks for read-only access to the payment processor and recalculates:
- Last month, 14 customers cancelled out of 500: customer churn of 2.8%.
- $800 of MRR was lost to cancellations and $300 to downgrades: gross revenue churn of 5.5%.
- $900 came from upgrades, so net revenue retention was 99%.
The difference between 2% and 5.5% is explained when the buyer looks at cohorts: customers who joined through a discount promotion six months ago are cancelling at a much higher rate than everyone else, and a few larger customers downgraded. Customers who joined at full price churn at under 2% a month.
The buyer doesn’t walk away. Instead, the offer reflects the higher blended churn, and the buyer plans to stop discount-led acquisition after the purchase. The seller, seeing the analysis, agrees the “about 2%” figure only described the best cohort.
Checking churn properly: cohorts
A single churn figure hides a lot. A cohort analysis groups customers by the month they joined and tracks how many remain each month afterwards. It shows:
- Whether newer customers churn faster or slower than older ones.
- Whether a promotion, price change or product change affected retention.
- Whether churn is concentrated in the first few months, which often points to onboarding problems.
Buyers should build cohorts from the payment processor’s raw data rather than from summary dashboards. Our guide to SaaS due diligence explains how to request and read the data.
Churn and customer lifetime value
Churn also tells you roughly how long an average customer stays. A common approximation is that the average customer lifetime, in months, is 1 divided by the monthly churn rate. At 2% monthly churn, that’s about 50 months; at 5%, about 20 months.
Multiply that by the average monthly revenue per customer and you get a rough customer lifetime value. A customer paying $40 a month is worth about $2,000 in revenue at 2% churn, but only about $800 at 5%. That figure tells a buyer how much the business can afford to spend acquiring each new customer, and therefore how fast it can grow profitably.
These are simplified averages. Real customers don’t all behave the same way, which is why cohort analysis matters. But the approximation is a quick way to see how much a change in churn is worth.
Annual plans and churn
Products that sell annual plans churn differently. Customers can only leave at renewal time, so monthly churn looks low for most of the year and then concentrates around renewal dates. When comparing businesses, look at annual renewal rates for annual plans and monthly churn for monthly plans, rather than blending the two.
Annual plans usually reduce churn overall, because customers commit for longer and have more time to get value from the product. They also bring cash in up front. For a buyer, a healthy share of annual plans is a positive sign, provided renewal rates are strong. Check how much of the revenue a buyer will receive after the sale has already been paid to the seller in advance, and agree how that’s handled in the deal terms.
Reading churn in a listing
When a listing quotes a churn figure, ask four questions: is it customer or revenue churn, monthly or annual, which period does it cover, and how was it calculated? A precise answer with access to the underlying data is a good sign. A round number with no source is a starting point for questions, not a fact to rely on.
Common causes of churn
- Poor onboarding: customers never reach the point where the product is useful.
- Failed payments: expired cards and declined charges cause involuntary churn that can often be recovered.
- Wrong customers: discounts or broad advertising attract people the product doesn’t suit.
- Missing features or reliability problems.
- Price increases without clear added value.
- Customers’ own circumstances, such as businesses closing, which no product can prevent.
For sellers: reducing churn before a sale
Lowering churn in the year before a sale is one of the most valuable things a SaaS seller can do. Practical steps include improving onboarding so new customers reach value quickly, setting up payment retries and card-update reminders, encouraging annual plans, talking to customers who cancel to learn why, and fixing the most common reasons. Present churn honestly by cohort, with the explanation for any changes. Buyers trust sellers who show the full picture.
When you’re ready, you can list a software business on digiflippers.com with 0% success fee up to $10,000, then 5% (max $5,000).
Common mistakes
- Mixing monthly and annual churn.
- Counting new customers in the churn calculation.
- Quoting customer churn when revenue churn is higher, or the other way round, without saying which.
- Using a single month instead of a 6 to 12 month average.
- Ignoring involuntary churn from failed payments, which is often the easiest to fix.
SaaS churn rate: the checklist
- Period stated: monthly or annual.
- Customer churn and gross revenue churn both calculated.
- Net revenue retention calculated, including expansion.
- Six to twelve months of figures, not one month.
- Cohort analysis built from the payment system’s raw data.
- Causes of churn identified, including failed payments.
- Churn reflected in the valuation multiple.
Ready to find your next asset?
Browse listings with verified numbers, ask sellers your questions before you offer, and agree every step in a free Deal Room.
Frequently asked questions
What is a good SaaS churn rate?
It depends on the customers and price point. Products sold to larger businesses usually churn less than low-priced products sold to individuals. Compare with similar products, and focus on whether churn is stable or falling.
What’s the difference between customer churn and revenue churn?
Customer churn counts lost customers. Revenue churn counts lost recurring revenue, including downgrades. Revenue churn is usually more relevant to valuation.
What does net revenue retention above 100% mean?
That revenue from existing customers grew over the period, because upgrades outweighed cancellations and downgrades.
How do buyers check churn?
By recalculating it from the payment processor’s data, ideally through read-only access, and building cohorts by sign-up month.
Does churn include failed payments?
Often, yes. Failed payments that aren’t recovered become involuntary churn. Many businesses reduce it with payment retries and reminders to update card details.
How many months of churn data should a buyer see?
At least 12 months where the business has that history, so seasonal patterns, price changes and promotions are visible. Cohort tables covering the full life of the product are even better.
Can a business with high churn still be worth buying?
Yes, if the causes are understood and fixable, such as poor onboarding or failed payments, and the price reflects the current churn rather than the hoped-for improvement.