SaaS Metrics Every Buyer Should Check (MRR, Churn, LTV, CAC)
A buyer's checklist of SaaS metrics: what each one means, how to calculate it from billing data, what to look for, and the warning signs that matter.

A SaaS business can look healthy on a single number and still be quietly shrinking. That’s why serious buyers don’t stop at “MRR is $20,000”. They look at a handful of SaaS metrics that together show whether customers stay, whether they spend more over time, what they cost to win and how much of each dollar is left after delivering the product.
This checklist explains the SaaS metrics every buyer should check before making an offer: what each one means, how to calculate it from billing data, what to look for and which warning signs matter. It’s written for buyers of small and medium SaaS products, but sellers can use it to prepare too.
Pair it with our pillar guide to buying a SaaS business, which covers the rest of the process.
Key takeaways
- Get the numbers from the billing system, month by month, for at least 12 months.
- Look inside MRR: new, expansion, churned and contraction revenue tell you more than the total.
- Churn is the metric that matters most; measure it for customers and for revenue.
- LTV and CAC only mean something together, and only when churn is honest.
- Margins and concentration show how much of the revenue is really yours and how fragile it is.
First: where the numbers come from
Every metric below is only as good as the data behind it. Ask for read-only access to the billing system (Stripe, Paddle, Chargebee or similar) or a live screen share where you choose the date ranges. Spreadsheets prepared by the seller are useful for discussion, but the billing system is the source of truth. If the business uses Stripe Billing, Stripe’s own dashboards calculate MRR and churn, which gives you a consistent starting point.
Agree definitions at the start, too. Two people can calculate churn in different ways and both be “right”. What matters is that you use one method consistently across every month you compare.
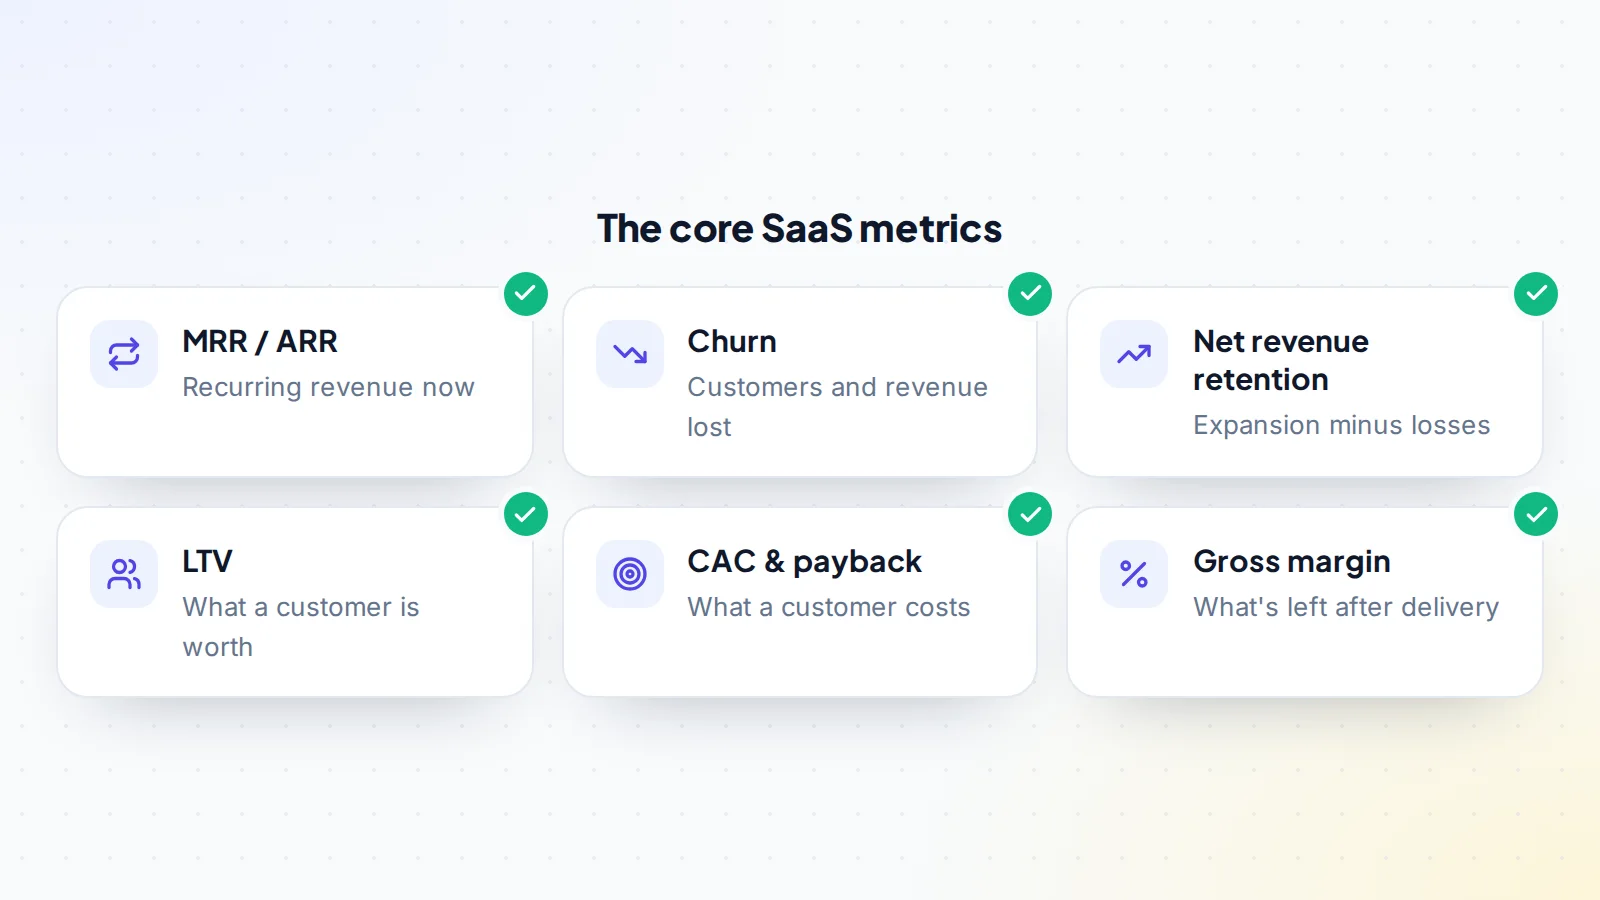
1. MRR and ARR
Monthly recurring revenue (MRR) is the predictable revenue from active subscriptions in a month. Stripe describes it as recurring income normalised to a monthly amount; a simple way to see it is paying customers multiplied by average revenue per user. Annual recurring revenue (ARR) is the same figure on a yearly basis, usually MRR × 12.
What to check:
- Annual plans are spread over 12 months. A $1,200 annual plan is $100 of MRR, not $1,200 in the month it was paid.
- One-off payments are excluded: setup fees, lifetime deals and services aren’t recurring.
- Discounts and coupons are reflected at the price customers actually pay.
- Failed payments are handled consistently; a subscription that hasn’t paid for weeks isn’t really revenue.
Read MRR vs ARR for more on when each figure is used.
2. The movement inside MRR
The total hides what’s happening underneath. Ask for MRR split into four parts each month:
- New MRR from customers who started paying that month.
- Expansion MRR from existing customers who upgraded or bought more.
- Churned MRR lost to cancellations.
- Contraction MRR lost to downgrades.
A business adding lots of new MRR can look healthy while churn quietly eats it. When marketing slows down, or when you take over and have less time to promote it, the churn remains. That’s why buyers look at what’s left when new MRR is removed.
3. Churn
Churn measures what you lose. There are two kinds, and you want both:
- Customer churn: customers lost in a month divided by customers at the start of the month.
- Revenue churn: MRR lost to cancellations (and, for gross revenue churn including downgrades, contraction) divided by MRR at the start. Stripe describes gross revenue churn as churned MRR divided by MRR at the end of the previous month.
Look at churn every month for a year and by customer group: plan, sign-up month (cohort) and acquisition channel. Rising churn, churn concentrated in recent cohorts, or churn that spikes after free trials end are all things to understand before you buy. Our guide to SaaS churn rate covers the calculations in detail.
4. Net revenue retention
Net revenue retention (NRR) shows how revenue from a group of existing customers changes over time, including upgrades, downgrades and cancellations. A common way to calculate it: take MRR from a group of customers at the start of a period, add their expansion, subtract their contraction and churn at the end, and divide by the starting MRR.
Above 100% means existing customers are spending more over time than you lose; below 100% means the existing base shrinks without new sales. For a buyer, it’s one of the clearest signals of whether the product keeps delivering value after the sale.
5. Lifetime value (LTV)
LTV estimates how much gross profit a typical customer brings over their time as a customer. A simple version is average revenue per account × gross margin ÷ monthly churn rate.
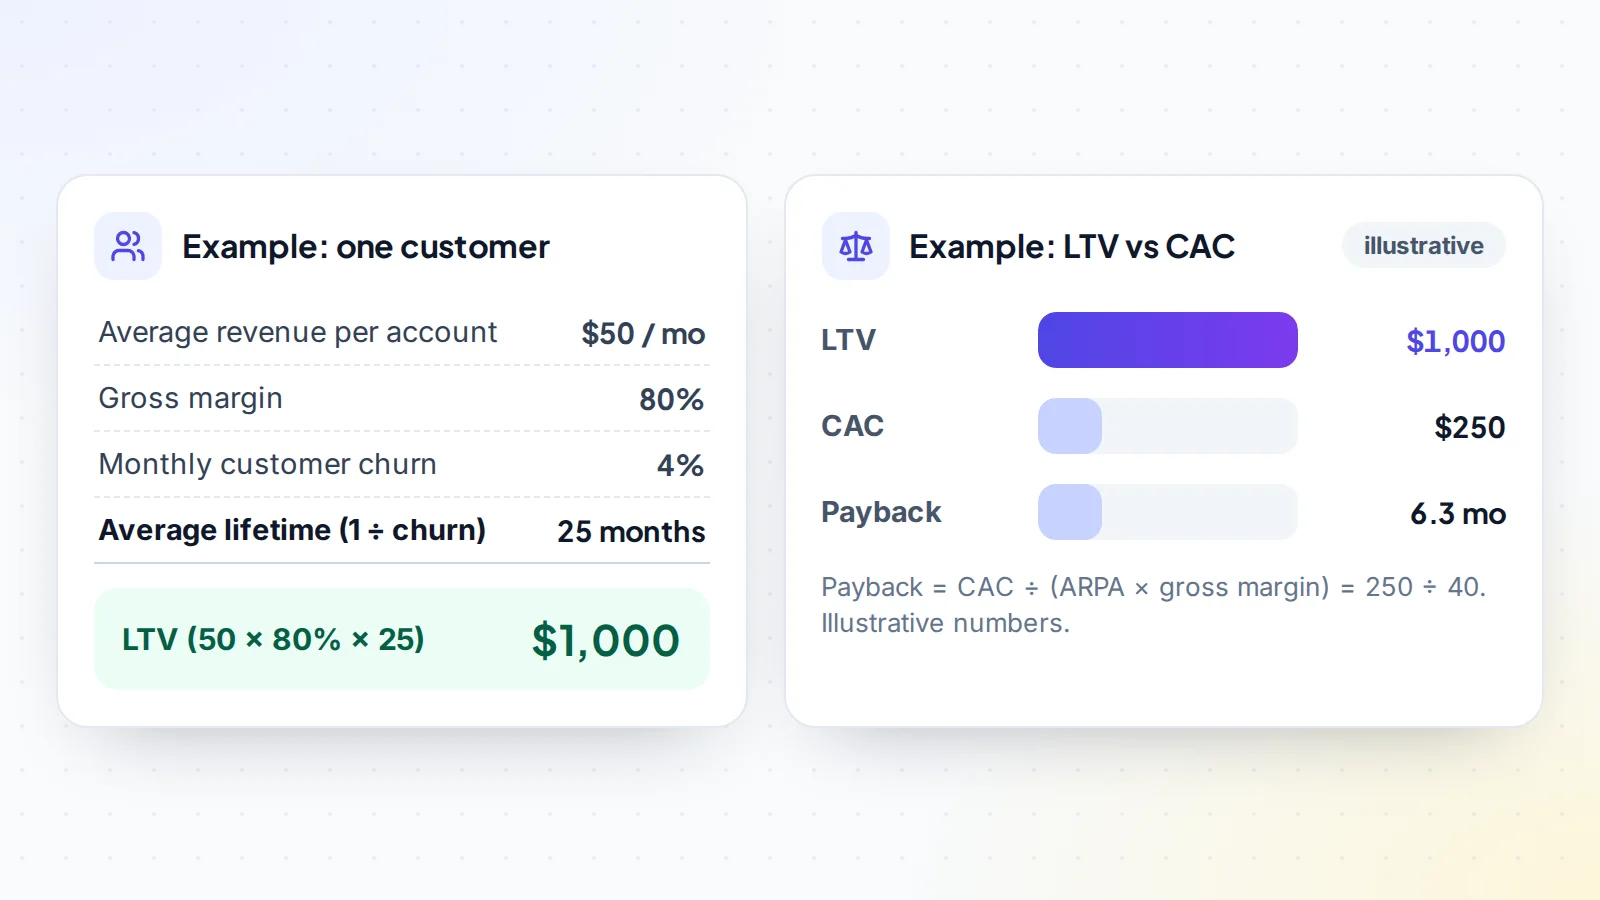
LTV is very sensitive to churn: halve the churn and LTV doubles. That’s why LTV figures based on a few good months, or on optimistic churn, can be misleading. Recalculate it yourself from the billing data.
6. Customer acquisition cost and payback
CAC is what it costs to win a new paying customer: marketing and sales spend in a period divided by new customers in that period. Payback is how many months of gross profit it takes to recover that cost.
For small SaaS businesses where most customers come from search, word of mouth or marketplaces, CAC can be low. If growth depends on paid ads, check the numbers carefully: rising ad costs can turn a profitable business into a loss-making one. A healthy business has LTV comfortably above CAC and a payback period it can afford.
7. Gross margin and costs
Gross margin is revenue minus the direct cost of delivering the product (hosting, infrastructure, third-party APIs, payment fees, support), as a share of revenue. Software is often high-margin, but products that rely heavily on paid APIs, AI models or human support can be much lower. Ask for every cost line and how it scales with customers. See SaaS pricing strategy for how pricing interacts with margin.
8. Other metrics worth checking
- Average revenue per account (ARPA): rising ARPA can mean customers value the product more.
- Trial-to-paid conversion: how many trials become customers, and how that has changed.
- Customer concentration: the share of MRR from the top customers. If one customer is a large share, losing them changes the business.
- Refunds and chargebacks: both reduce real revenue and can signal product or billing problems.
- Active usage: logins or key actions per customer. Customers who pay but never log in are likely to cancel.
- Support load: tickets per customer, which affects the time and cost of running the business.
A worked example
Imagine a small B2B tool with $15,000 of MRR. Over the last year, it added about $1,200 of new MRR a month, gained $300 a month from upgrades, lost $750 a month to cancellations and $150 to downgrades. Revenue churn is therefore around 6% a month ($900 ÷ $15,000), and net new MRR is about $600 a month.
Looking by cohort, customers who joined through search stay much longer than those who came through a lifetime-deal promotion two years ago, most of whom have since cancelled. Gross margin is about 85% after hosting, email delivery and payment fees. The top five customers make up 12% of MRR. Customer acquisition cost is low because most customers find the product through search and a marketplace listing.
A buyer reading these SaaS metrics would see a sound business with one clear task: reduce churn among smaller customers. They’d price in today’s churn, not a hoped-for improvement, and might plan an annual-plan offer to lift retention after the purchase. That’s the value of looking beyond the headline number.
How the metrics differ by type of SaaS
Self-serve tools with low prices usually have higher customer churn and lower CAC; buyers focus on churn and on how efficiently the product attracts new users. Sales-led B2B products have larger contracts, lower churn and higher CAC; buyers focus on concentration, contract terms and the sales pipeline. Plugins, browser extensions and apps often mix one-off and recurring income, so separating the two is the first job. Whatever the type, the logic of the checklist stays the same.
Tools that help
You don’t need special software to check these metrics, but it helps. Most billing platforms show MRR, churn and active subscriptions in their own dashboards, and many offer exports by month and by customer. Spreadsheet templates can turn those exports into cohort tables in an afternoon. Analytics tools show usage, and support desks show ticket volume. Ask the seller which tools they use, and whether you can see each one live during due diligence.
Warning signs
- MRR shown only as a screenshot or spreadsheet.
- Lifetime deals or one-off fees counted as recurring revenue.
- A jump in new customers just before the sale, driven by heavy discounts.
- Churn the seller can’t or won’t calculate.
- Net revenue retention well below 100% with no explanation.
- Most revenue from a few customers on custom deals.
For sellers: preparing your metrics
If you’re selling, preparing these numbers before you list is one of the best investments of your time. Export a month-by-month table from your billing system with MRR and its four movements, customer and revenue churn, and the number of active customers. Add a cohort view if your billing tool provides one. List every delivery cost so buyers can see your gross margin, and note anything unusual, such as a price change or a promotion, next to the month it happened. Buyers trust sellers who show their weaknesses alongside their strengths, and clean metrics shorten due diligence from weeks to days. Our guide to selling a SaaS business covers the rest of the preparation.
Using the metrics in your offer
The metrics don’t just decide whether to buy; they shape the price and the terms. Lower churn, healthy retention, low concentration and strong margins justify a higher multiple. Weaknesses can be priced in, or handled through terms such as an earn-out tied to retention. Whatever you find, write it down and explain your offer with it: sellers respond better to evidence than to a bare number. Our guide to add-backs helps you check the profit figure the price is based on, and checking an online seller covers the people side.
SaaS metrics: the buyer’s checklist
- 12+ months of data from the billing system, read-only or live.
- MRR with annual plans spread and one-off payments excluded.
- MRR split into new, expansion, churned and contraction each month.
- Customer and revenue churn by month and by cohort.
- Net revenue retention calculated.
- LTV recalculated from real churn and margin.
- CAC and payback by channel.
- Gross margin with every delivery cost listed.
- Customer concentration, refunds and chargebacks checked.
- Usage and support load reviewed.
Ready to find your next asset?
Browse listings with verified numbers, ask sellers your questions before you offer, and agree every step in a free Deal Room.
Frequently asked questions
What are the most important SaaS metrics for a buyer?
MRR (and how it moves), churn, net revenue retention, LTV, CAC and gross margin. Churn usually matters most, because it decides how long revenue lasts.
How do I calculate MRR?
Add up the monthly value of all active subscriptions, with annual plans divided by 12 and one-off payments excluded.
What is a good churn rate?
It depends on price point and customer type. What matters most is that churn is stable or falling, calculated consistently from billing data, and reflected in the price.
What is net revenue retention?
The change in revenue from existing customers over a period, including upgrades, downgrades and cancellations, as a share of their starting revenue.
Should I trust the seller’s LTV figure?
Recalculate it yourself. LTV depends heavily on churn and margin, and small changes in either change the result a lot.
Which metric should I check first?
Revenue churn. If revenue leaves faster than the business can replace it, every other metric eventually suffers.
How far back should I look?
At least 12 months, and longer if available. Seasonal businesses need at least two full years to compare like with like.
Do these metrics apply to small SaaS products?
Yes. Even a micro SaaS with a few hundred customers should be judged on MRR, churn and margin; the numbers are smaller, but the logic is the same.